

Another week grinds with market action remaining muted as the “dogs days of summer” finally come to a close. But it is next week, as global Central Bankers converge on Jackson Hole, Wyoming, which may give the market some direction before the final push into the November elections.
As Tyler Durden noted on Zerohedge:
“Fed Chair Yellen is scheduled to talk on Friday, the 26th (the timing of her speech has not yet been released).She is likely to spend time discussing the latest star at the Fed – R*, which is the equilibrium Fed funds rate. The short-term R*, which represents the equilibrium rate impacted by current headwinds, is believed to be about 0% in real terms. With the real Fed Funds rate running below, Yellen will likely argue that policy is still accommodative. We expect Yellen to reiterate the desire to keep policy stimulative, given a ‘risk-management’ approach. There is asymmetry to policy when so close to the zero bound – hiking too quickly could derail the economy, but going slowly will simply mean a risk of having to play catchup. In this context, Yellen might argue that conditions are increasingly being met to further normalize rates before the end of the year, consistent with the latest communication from the FOMC. However, we do not expect guidance on the exact timing of the next hike.”
The more in-depth conversation is likely to be over how policymakers should calibrate policy going forward, assuming that R* is permanently lower and central bank balance sheets are permanently larger. This goes back to the topic of the conference – designing resilient frameworks. We think this will include debates about financial stability concerns, global central bank policy coordination, benefits/costs of negative rates and the effectiveness of forward guidance. “
Here is the point. Given economic growth remains nascent and real interest rates, ie LIBOR, are rising, the risk of a monetary policy error for the Fed has grown markedly. As I addressed previously:
“In other words, increases in LIBOR tightens the flow of liquidity in many of the debt markets that directly affect the average consumer and small business by increasing costs. This is particularly burdensome when annual rates disposable income growth is on the decline.
Danielle DiMartino-Booth pointed out this problem in her latest post:
“Disposable personal income growth, adjusted for inflation, grew by 2.2 percent over last year, a full percentage point below March’s 3.2-percent pace. That downshift helps explain two things. For starters, the saving rate fell in June to 5.3 percent, the lowest since last October. Meanwhile, revolving credit growth, aka credit card spending, galloped ahead at a 9.7-percent annual rate.”

“In other words, consumers are turning to credit consumption to support their current standard of living rather than the expansion of consumption. This is why economic growth continues to wane.
This brings me to my point. If it is LIBOR that affects the consumer, and ultimately economic growth given the 70%ish contribution of consumption to it, then we should be looking at the rates that directly impact the consumer. Whether it is auto loans, mortgages, variable rate debt, credit cards, etc., those interest rate costs are directly impacted by changes in LIBOR.
We can see this more clearly by looking at the very short-end of the yield curve and the spread between the 2-year Treasury rate and the 1-month LIBOR.”
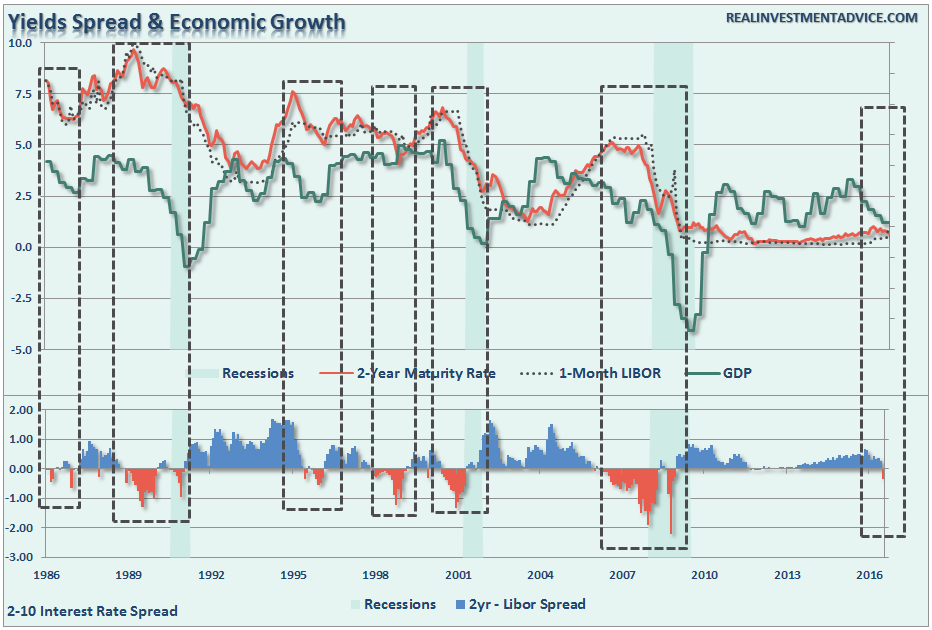
As shown, there is a very high correlation between negative spreads and future economic growth. In every instance where there has been a negative spread on rates, the economy has either slowed markedly or was in a recession.
The problem for the Fed is now trying to play catch up with LIBOR without pushing a 1%-growth economy into recession.
With interest rates near their lowest levels in history, and roughly 500-million people globally under NEGATIVE rates, there is little evidence of a resurgence of economic growth on the horizon. As Simon Black correctly stated:
“Remember that money is essentially nothing more than a measurement of economic value, in the same way that a meter or a mile is a measure of distance.
Just imagine the chaos if there were some unelected committee of bureaucrats who got together from time to time to change the value of the mile. Or imagine if, tomorrow morning, they decided that the mile would be shortened by 20%.
Some people would benefit from that arrangement (taxi drivers). Others would be worse off (taxi passengers).There are always winners and losers.
Similarly, there are always winners and losers with monetary policy.
And these unelected central bankers have made a series of very deliberate decisions to forsake one segment of the population (anyone trying to save money) for the benefit of another (those who are heavily in debt, like, ummmm, governments).”
Bingo!
Unfortunately, however, the problem of forsaking savers over debtors is simply “savings” is what drives economic growth. Surging debt levels is a detractor to savings and ultimately diverts money from productive investments into debt service.
As John Hussman noted this past week:
“I can’t emphasize strongly enough that there is no economic evidence that activist monetary intervention has materially improved economic performance in recent years. Specifically, the trajectory of the economy in recent years has followed a largely mean-reverting course that one could have anticipated simply on the basis of lagged economic data, and there is no economically meaningful difference in the projected trajectories of GDP, industrial production, and employment using purely non-monetary variables, compared with projections that include measures of recent extraordinary monetary policy.”
This is, of course, absolutely correct. The problem for Global Central Bankers is they are attacking the problem with a blunt instrument that has already been proved to “fail” over long periods of time. As discussed earlier this week, the Fed has become caught in the same “liquidity trap” that has plagued Japan for the last 30-years.
“The signature characteristic of a liquidity trap are short-term interest rates that are near zero and fluctuations in the monetary base that fail to translate into fluctuations in general price levels.”
As the chart below shows, the Fed has actually been trapped for a very long time but has failed to realize it. This has kept the Fed inflating asset prices and suppressing yields for far too long which, as discussed below, has led to“euphoric market conditions with poor outcomes.”
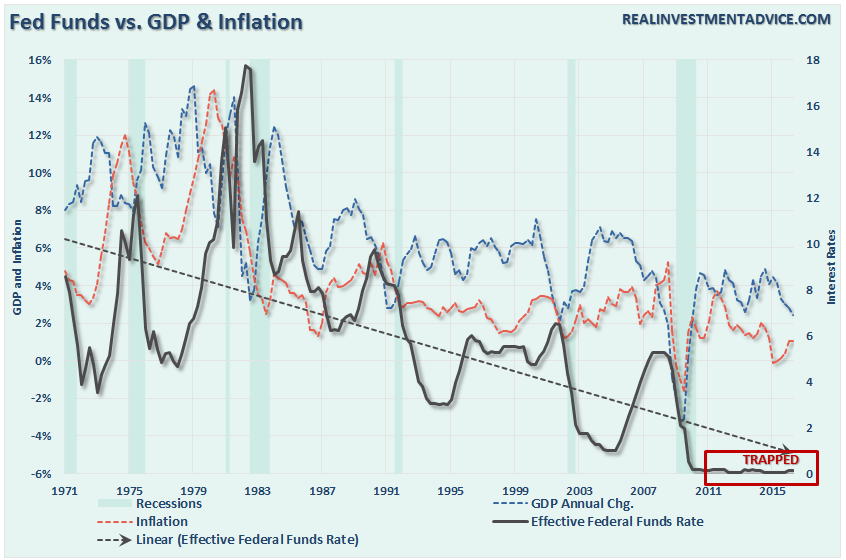
What was that definition of insanity again?
Euphoria Already Upon Us
As I noted last week:
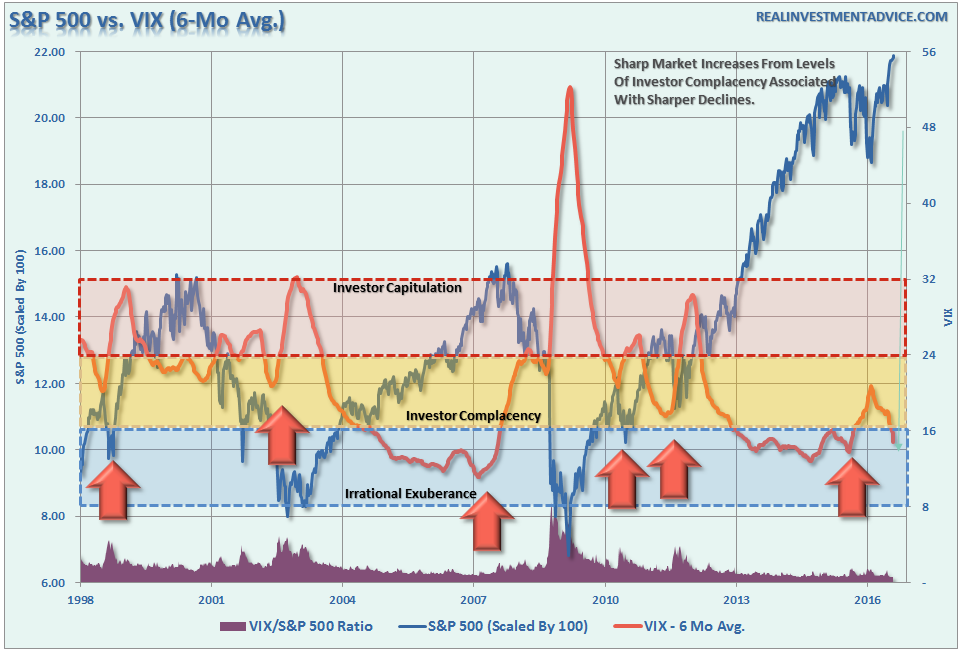
“The level of “complacency” in the market has simply gotten to an extreme that rarely last’s long. The chart below is the comparison of the S&P 500 to the Volatility Index. As you will note, when the momentum of the VIX has reached current levels, the market has generally stalled out, as we are witnessing now, followed by a more corrective action as volatility increases.”

Disclosure: I am currently long the volatility index as of this past Monday.
The bet on a sharp rise in volatility is a hedge against a sharp reversion in asset prices as the high level of“complacency” unwinds. As Eric Parnell recently wrote:
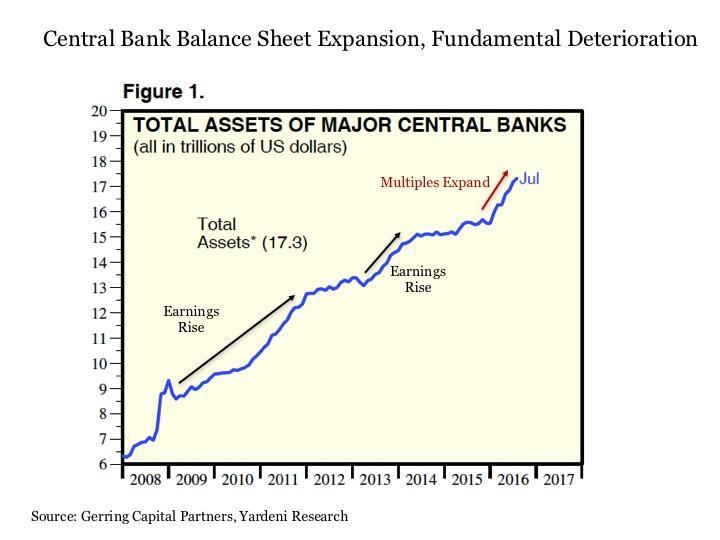
“So if its not in the broader market as measured by the S&P 500 Index where exactly does the euphoria lie today? It does not lie in stock prices themselves, but instead in how much investors are willing to pay for each dollar of earnings from owning stocks, or more simply the price-to-earnings ratio. For while the S&P 500 Index has effectively gone nowhere since the end of 2014 on a price basis, the price that investors have been willing to pay for each dollar of earnings provided by stocks has soared by more than +30% over this same time period.”
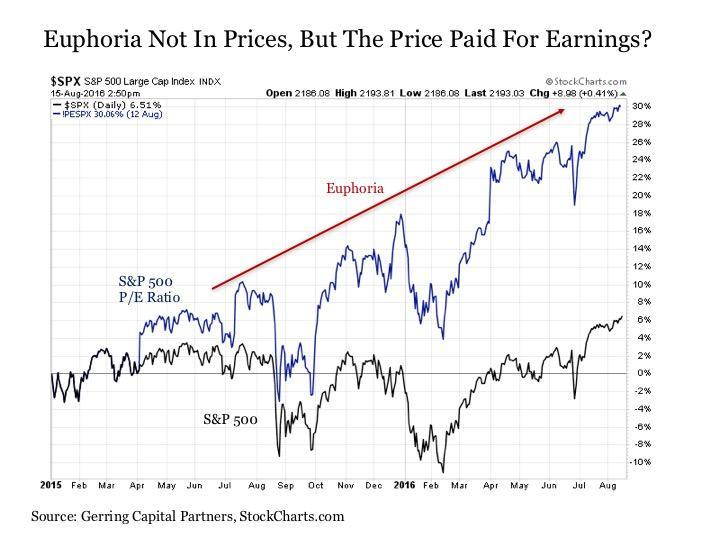
“Such rapid multiple expansion is certainly not necessarily unheard of throughout market history. But it typically takes place either in the immediate aftermath of a bear market or when absolute valuations are well below the historical average in the 5 to 12 times earnings range, not at the later stages of a bull market when valuations were already relatively high.
We have seen only three other instances over the past century where a comparable degree of multiple expansion from already high absolute valuations took place. These were 1928-29, 1986-87, and 1998-99. Two of these instances ended notoriously badly, the third resulted in the worst one-day decline in market history from which it took two years to recover despite the dawn of the Fed “put” era. Given that we are similar multiple expansion territory today that has led us to the second highest market valuations in history, it will be interesting to see how this fourth episode plays out.”
As I stated above, it is the repeated Central Bank interventions that have led to this extreme level of complacency combined with over euphoric valuations as the “chase for yield” has ensued. Back to Eric:
“But what is the driving force behind today’s multiple expansion euphoria? The most likely culprit is the relentless expansion of global central bank balance sheets since the outbreak of the financial crisis nearly a decade ago. Overall, global central bank balance sheets have expanded from just over $5 trillion prior to the crisis in 2007 to nearly $18 trillion today.”
There is little doubt we are currently in a bull market. But as with all things, despite hopes from the mainstream media to the contrary, they do come to an end. This should be of no real surprise to anyone that has managed money for any length of time. As John’s concludes:
“The outcome of years of yield-seeking speculation induced by central banks is that investors across the globehave now locked in zero prospective total returns in virtually in every asset class for the coming decade.
Near term, the single most likely outcome in any given week is a small gain, but that likelihood is also offset by the small probability of a wicked loss that can easily wipe out weeks or months of upside progress in one fell-swoop. Those plunges are random in the sense that we have no idea when they will occur, but they are alsopredictable in the sense that the underlying probability distribution of returns, during overextended conditions similar to the present, has been fairly stable across decades of market history.
Looking beyond the near-term, my view is that a ‘permanently high plateau’ is unlikely, and we will instead see a violent unwinding of recent speculative extremes over the completion of the current market cycle, even if central banks ease aggressively, as they did throughout the 2000-2002 and 2007-2009 collapses. Corporate income growth and profit margins have already begun to narrow from their extremes, and the default cycle has already turned higher. The completion of this cycle won’t arrive because central banks suddenly become enlightened enough to abandon their recklessness. It will arrive precisely because they have sustained yield-seeking speculation for too long already; because they have amplified the vulnerability of the debt and equity markets to normal economic fluctuations; and because the consequences of this fragility are now fully baked in the cake.”
While you may, or may not, agree with John’s position it can be proved both mathematically and historically.
As I have noted repeatedly in the past, maintaining your portfolio through a disciplined investment process will reduce risk and increase long-term profitability. With markets currently hovering near all-time highs, despite a continuing erosion of underlying fundamental and technical strength, the risk/reward ratio remains out of favor.
- Tighten up stop-loss levels to current support levels for each position.
- Hedge portfolios against major market declines.
- Take profits in positions that have been big winners
- Sell laggards and losers
- Raise cash and rebalance portfolios to target weightings.
The Monday Morning Call – Analysis For Active Traders
3 Signs Of Excess Bullishness
I have written over the last several weeks that despite much mainstream media commentary to the contrary, actual“bullishness” in the market was hitting extremes. Here are 3-signs:
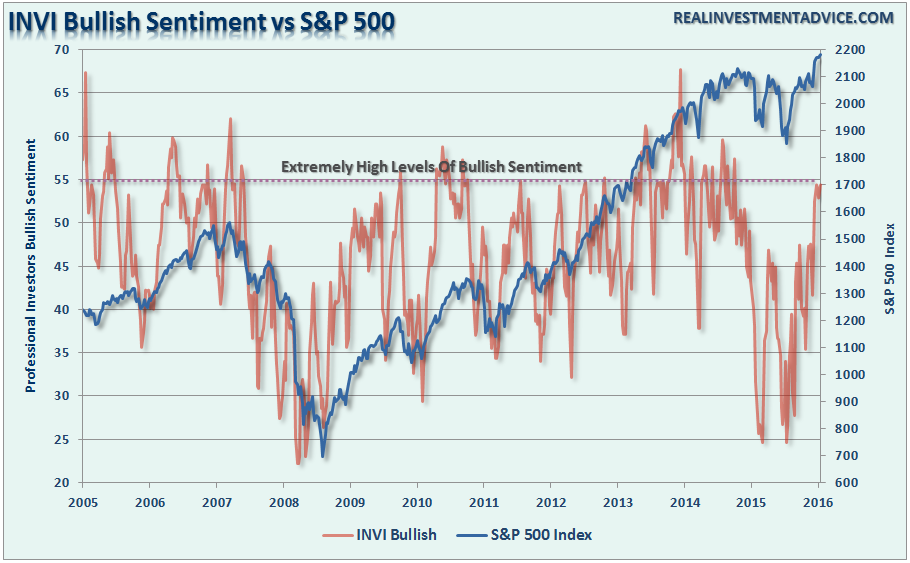
- With professional investors, as represented by the IINV Sentiment Survey, pushing more exuberant levels of bullishness the potential for a short-term reversal in the markets is more than elevated.
- The chart below shows the S&P 500 as compared to the level of volatility as represented by the 6-month average of the Volatility Index (VIX). I have provided three different bands showing levels of investor sentiment as it relates to volatility. Not surprisingly, as markets ping new highs, volatility is headed towards new lows.
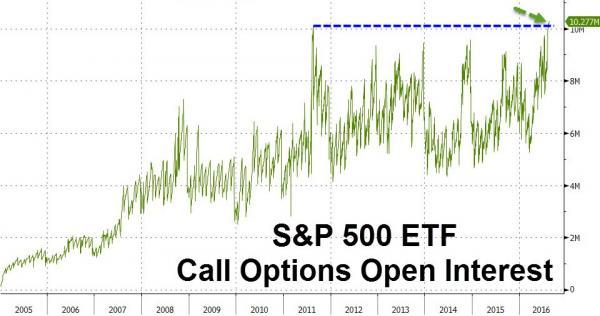
- The open interest in S&P 500 ETF (NYSEARCA:SPY) call options has never been higher as the last few days panic-buying leveraged long positions lifted exposure above summer 2011 highs…The last time SPY call option open interest was this high, S&P 500 tumbled 20% in 2 months amid the US downgrade…The level of bullish bets that the SPDR S&P 500 exchange-traded fund will rise reached a record this month and hit the highest level since January relative to bearish options. (h/t ZeroHedge)
With speculative positioning in VIX futures at record shorts (most bullish), professional investors extremely bullish, and speculative longs in Dow and Nasdaq at or near record highs, the question seems to not be “IF” if a correction will happen, just “WHEN.”
Oil Back To Extremes
Two week’s ago I asked the question “Is This The Bottom For Oil Prices?”
“The current deviation between the S&P 500 and oil contracts will likely not last long. Either the S&P 500 is due for a more meaningful correction, as discussed above, or there is about to be a rapid rise in oil prices.”
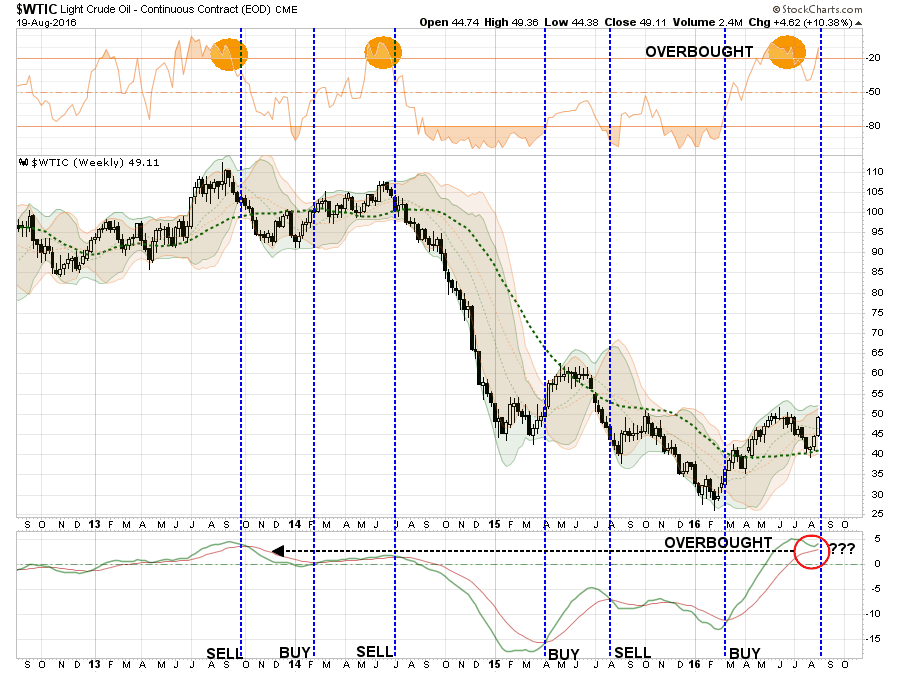
The latter happened to oil prices over the last two week’s as it rebound sharply from extreme oversold to overbought conditions. As shown below, oil sold off to minor support which was 3-standard deviations below the short-term moving average. The good news is the bounce held support and has now pushed oil prices back into extreme overbought territory.
While potential upside on oil could be as high as $52/bbl, the more likely outcome is a correction that would coincide with a rebound in the dollar as I will address momentarily. As shown below, oil prices are now as overbought as they have been since the peak in 2013. Watch the bottom indicator for an important sell signal WHEN it occurs.
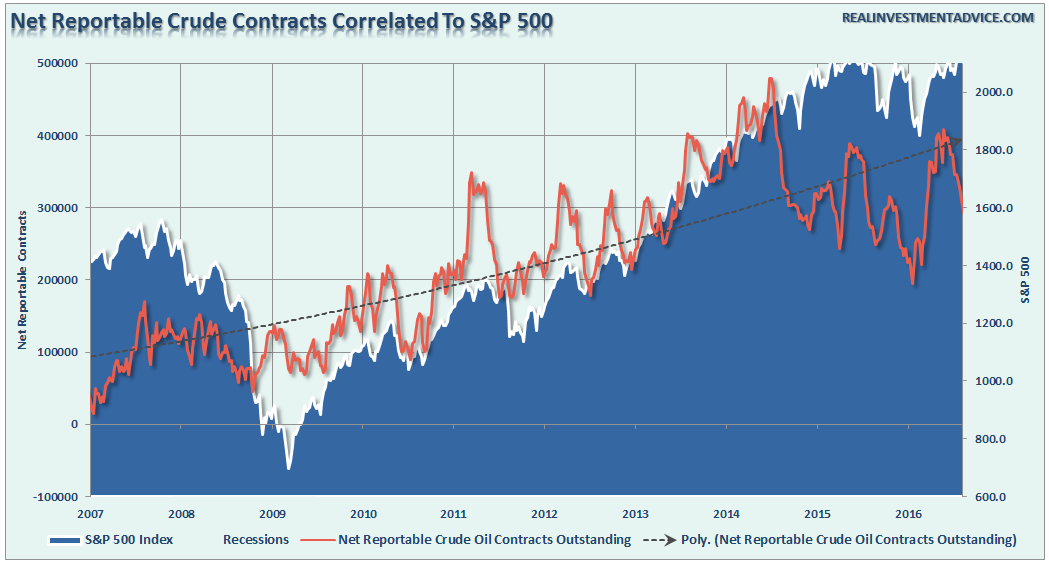
Currently, the number of net reportable contracts remains heavily biased to the long side. If oil prices break to the downside you should expect to see a rather rapid unwinding of contracts, and subsequently oil prices, to lower levels.I would suspect that my long-term target of $30-35/bbl will prove very realistic.
US Dollar Correction Likely Over
I wrote at the beginning of July the rise in the dollar would likely to continue which would suppress both oil prices AND earnings. As noted:
“While earnings are set to decline again this quarter which will push valuations even further into the proverbial stratosphere, the real risk to watch is the US Dollar. While Central Banks have gone all in, including the BOJ with additional QE measures of $100 billion, to bail out financial markets and banks following the “Brexit” referendum, it could backfire badly if the US dollar rises from foreign inflows. As shown below, a stronger dollar will provide another headwind to already weak earnings and oil prices in the months ahead which could put a damper on the expected year-end “hockey stick” recovery currently expected. “
Unlike the stock market which is pushing extreme overbought levels, the dollar is at an extreme oversold condition and has only started a potential longer-term move higher. This is something to pay very close attention to in the months ahead.
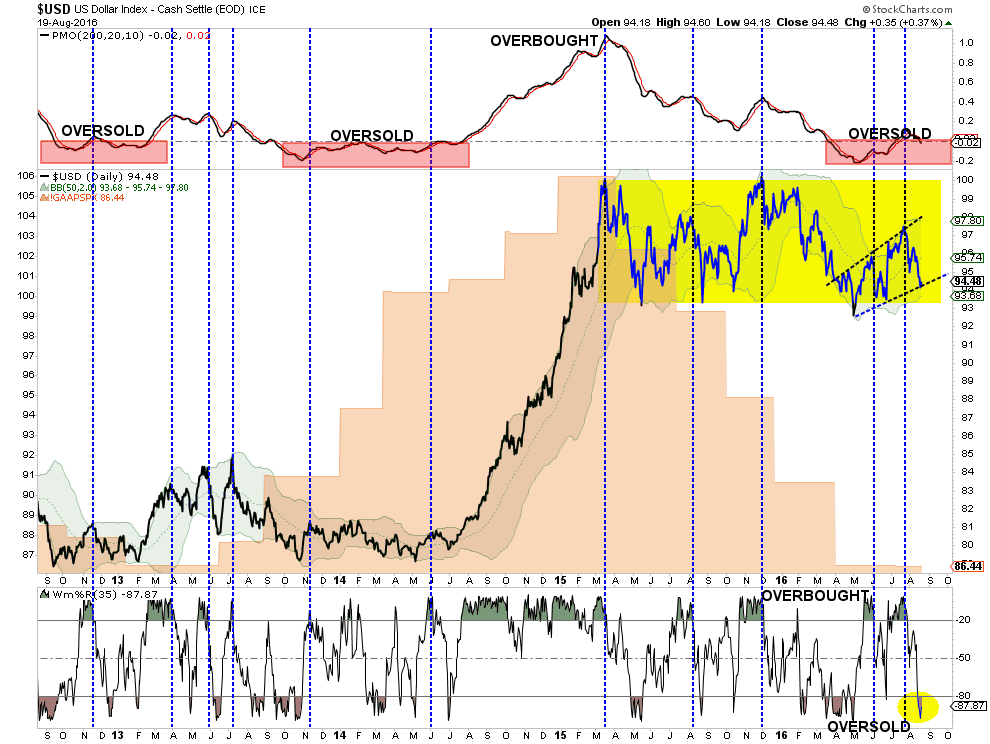
As noted, with interest rates negative in many areas of the world, the push of capital into the U.S. for a higher return on reserves is very likely. A further strengthening of the dollar will have a deleterious effect on oil prices, emerging markets, and corporate profitability. The net positive will be further inflows into U.S. bonds.
The bottom line is there is a wicked setup being developed that could lead to a rapid destruction of capital if something “goes wrong” in the weeks or months ahead. With the risk/reward ratio very negative currently, caution is highly advised.
Model Update
S.A.R.M. Sector Analysis & Weighting
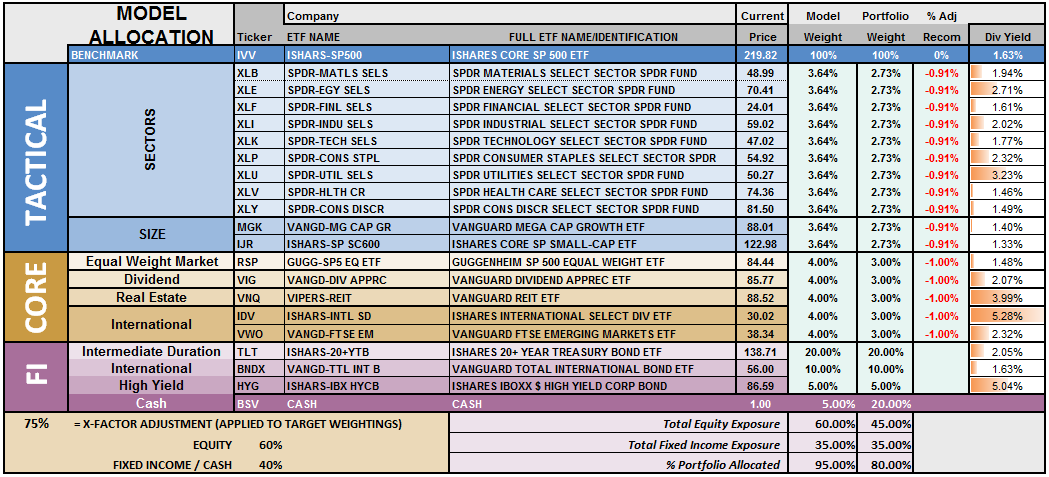
Not surprisingly, given the lack of direction or resolution of the current overbought condition, the portfolio equity risk weighting remains at 50% again this week. However, as stated above, this allocation will increase to 75% given the appropriate correction of the overbought condition. With all buy signals currently in place, and the bullish trend intact, this is not a market to bet heavily against…for now. However, it is also not a market to become extremely complacent in either.
Again, we must be given the right “set up” to increase equity allocations. Begin by “averaging up” in existing holdings to match model allocation and weights. When, and IF, the market confirms the continuation of the “bullish trend,” then begin adding new holdings to the model.
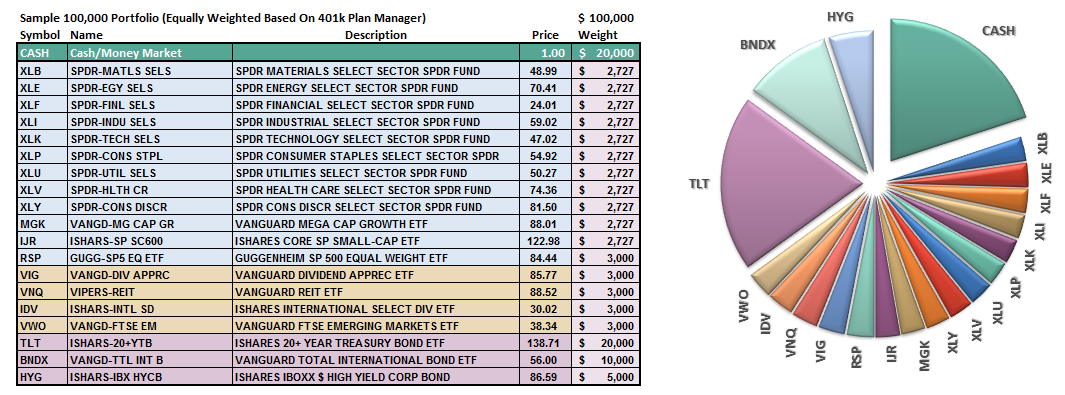
(Note: This is an equally weighted model example and may differ from discussions of overweighting/underweighting specific sectors or holdings.)
Relative performance of each sector of the model as compared to the S&P 500 is shown below. The table compares each position in the model relative to the benchmark over a 1, 4, 12, 24 and 52-week basis.
Historically speaking, sectors that are leading the markets higher continue to do so in the short-term and vice-versa. The relative improvement or weakness of each sector relative to index over time can show where money is flowing into and out of. Normally, these performance changes signal a change that last several weeks.
The fall in the US Dollar over the last could of weeks has boosted the performance of the energy, materials, and industrial sectors of the market. However, as stated above, we have likely gotten the majority of that advance already locked in so profit taking is likely wise.
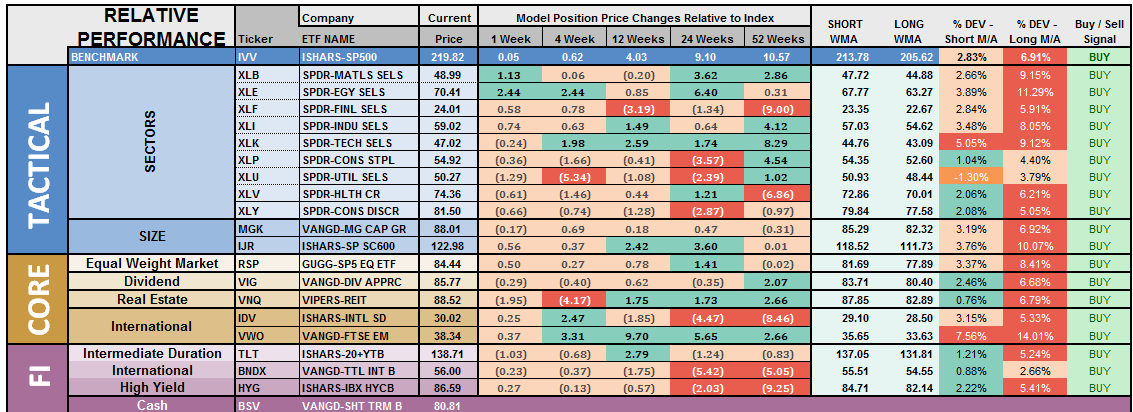
Notice in the next to last column to the right, the majority of all sectors and indices are pushing extreme levels of deviation from their long-term moving average. Such deviations can not, and do not, last long historically. A resolution of those deviations, which will occur during a corrective action, will provide the necessary risk/reward rebalancing to increase model allocations.
The two charts below graphically show the relationship of each position’s performance relative to the S&P 500 Index. If we are trying to “beat the index” over time, we want to overweight sectors/asset classes that are either improving in performance or outperforming the index, and underweight or exclude everything else.
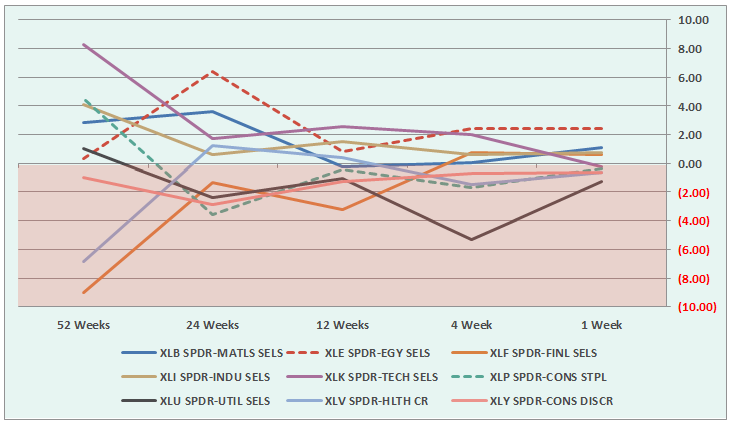
Sectors Currently Outperforming by >1%
- Energy
- Materials
Sectors Currently Performing In Line <>1%
- Industrials
- Staples
- Technology
- Financial
- Discretionary
- Healthcare
Sectors Currently Under Performing By >1%
- Utilities
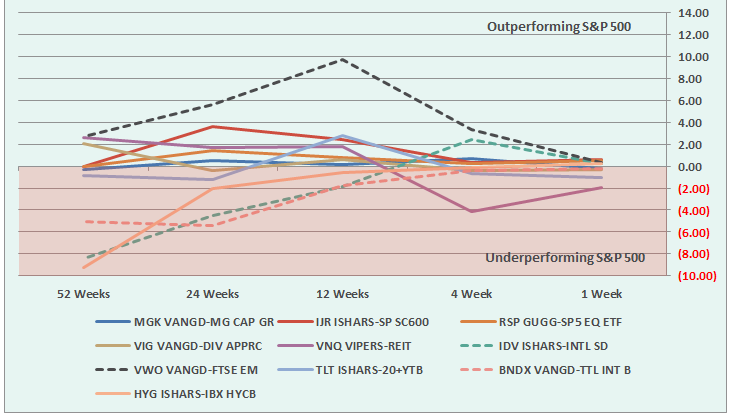
Index/Other Asset Classes Out Performing S&P 500 By >1%
- None
Index/Other Asset Classes Performing In-Line With S&P 500 <>1%
- Mid-Caps
- Small-Caps
- Equal-Weight S&P 500
- International Bonds
- High-Yield Bonds
- Dividend Stocks
- Emerging Markets
- International Stocks
Index/Other Asset Classes Under Performing S&P 500 By >1%
- Bonds
- REIT’s
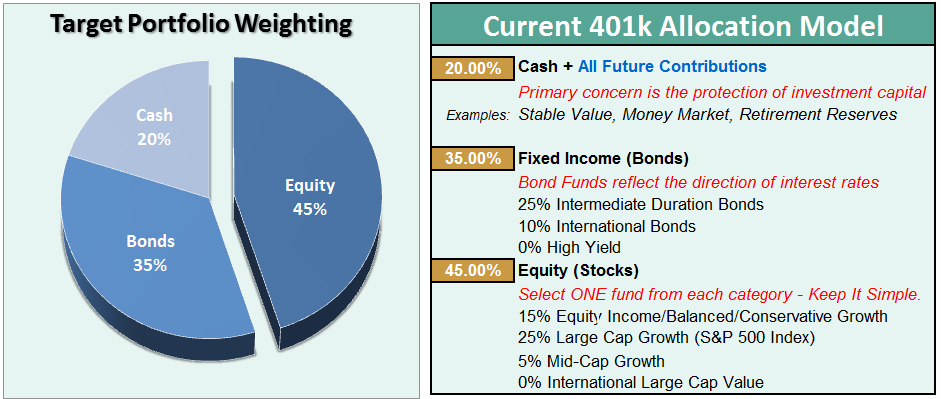
The risk-adjusted equally weighted model has been increased to 75%. However, as stated above, a pullback in the markets is needed before making any changes.
Such an increase will change model allocations to:
- 20% Cash
- 35% Bonds
- 45% in Equities.
As always, this is just a guide, not a recommendation. It is completely OKAY if your current allocation to cash is different based on your personal risk tolerance, time frames, and goals.
For longer-term investors, we still need to see improvement in the fundamental and economic backdrop to support the resumption of a long-term bullish trend. Currently, there is no evidence of that occurring.
The Real 401k Plan Manager – A Conservative Strategy For Long-Term Investors
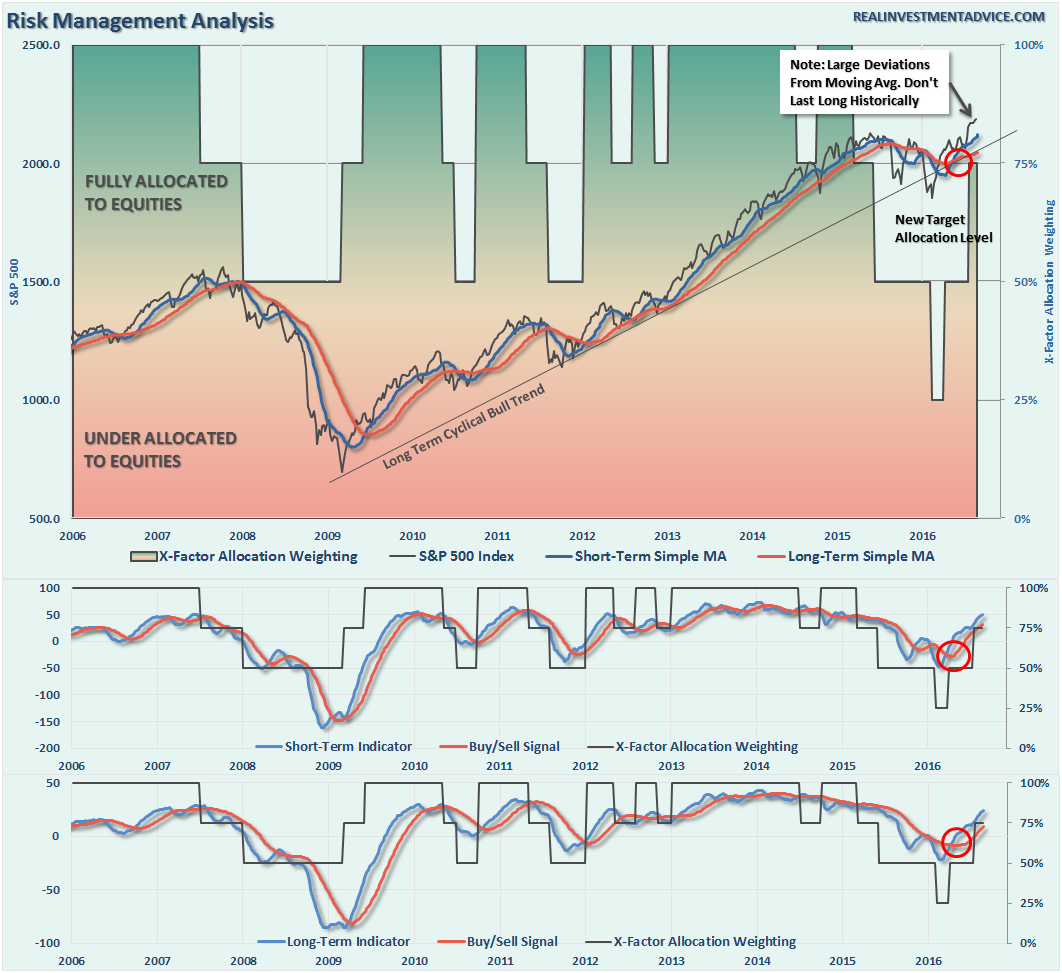
NOTE: I have redesigned the 401k plan manager to accurately reflect the changes in the allocation model over time. I have overlaid the actual model changes on top of the indicators to reflect the timing of the changes relative to the signals.
There are 4-steps to allocation changes based on 25% reduction increments. As noted in the chart above a 100% allocation level is equal to 60% stocks. I never advocate being 100% out of the market as it is far too difficult to reverse course when the market changes from a negative to a positive trend. Emotions keep us from taking the correct action.

Waiting On Godot
It seems as of late that we have continued to wait on an event that seems as if it will never come. Such is the trial of money management and a disciplined approach to investing over the pull of emotional biases.
Sometimes, it seems, we get the “feeling” that we should do “something.” Yet, as I try and detail here in this missive often, sometimes the best way to do “something” is to actually do “nothing.” Such is the case now.
With bullish biases running near extremes, the risk of “doing something” greatly outweighs the potential reward of“doing nothing.”
As discussed at length in the above missive, we certainly want to prepare ourselves to increase equity exposure in portfolios, however, we must patiently wait for the right conditions to apply those increases. Furthermore, while waiting for the relaxation of prices to make more prudent entries, it also enables investors to bypass potential “head fakes” of market actions.
Continue to do “something” by managing the inherent risk in your portfolio by:
- Reviewing the allocation model adjustments below
- Identifying the next course of actions in your 401k-plan
- Waiting to make adjustments until technical conditions improve.
- Changing allocations to target levels when conditions are right.
Current 401-k Allocation Model
The 401k plan allocation plan below follows the K.I.S.S. principal. By keeping the allocation extremely simplified it allows for better control of the allocation and a closer tracking to the benchmark objective over time. (If you want to make it more complicated you can, however, statistics show that simply adding more funds does not increase performance to any great degree.)
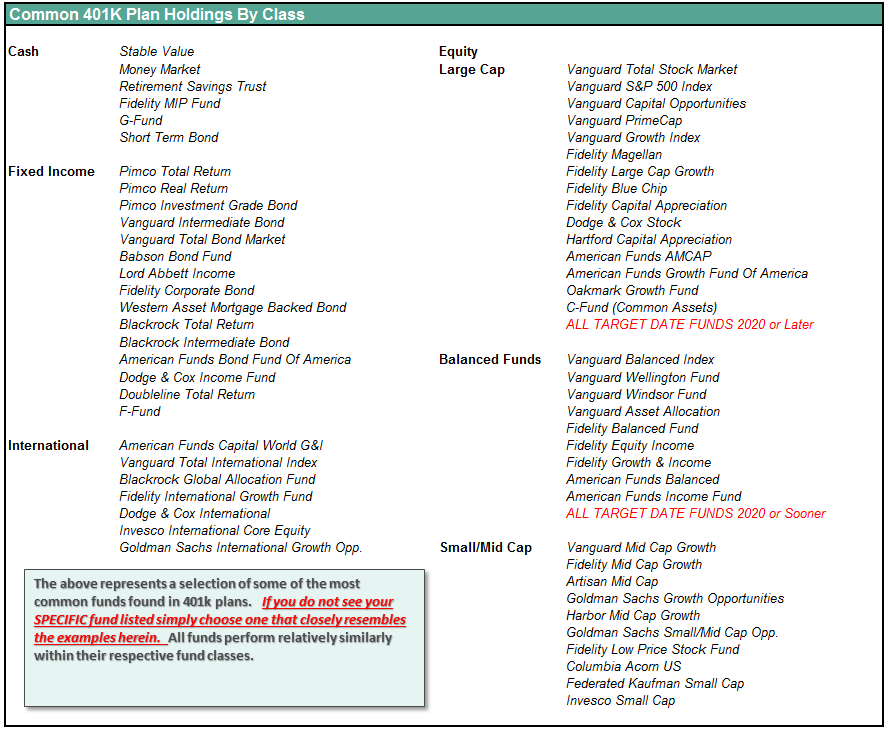
401k Choice Matching List
The list below shows sample 401k plan funds for each major category. In reality, the majority of funds all track their indices fairly closely. Therefore, if you don’t see your exact fund listed, look for a fund that is similar in nature.
All Eyes On Jackson Hole – Seeking Alpha